Mixed logit (experimental)
mixlogit_stream is a prototype (see the
reference); this benchmark checks it against
the exact estimates and against xlogit and jaxlogit, which are built for
the mixed logit.
The model is the conditional logit of the Swissmetro benchmark with a normally distributed coefficient of travel time, and the survey’s panel structure: each respondent’s nine choices share one draw of the coefficient (xlogit’s Swissmetro example).
Accuracy
With one random coefficient, a respondent’s likelihood is a one-dimensional integral, which quadrature computes exactly. Gauss–Hermite quadrature does not converge here: with σ near 3.6 and trips of several hundred minutes, the likelihood is nearly a step function of the draw. Gauss–Legendre quadrature on [−9, 9] with 2,000 nodes is converged to 1e-6. Maximizing that exact likelihood gives ASC_TRAIN −0.575, ASC_CAR 0.282, TT −3.222, CO −1.660, σ 3.652, log-likelihood −4,359.413.
Logit-stream, xlogit and jaxlogit use the same Halton draws (consecutive points of the base-2 sequence for each respondent, the first 100 discarded), so at the same number of draws they maximize the same simulated likelihood. Biogeme (its base-2 Halton draws) and R’s logitr draw their own, so theirs differ by the simulation error. The simulated log-likelihoods at the survey’s 752 respondents, and the largest difference of a coefficient from the exact estimates in parentheses:
draws |
logit-stream |
xlogit (L-BFGS-B) |
jaxlogit |
Biogeme |
logitr (R) |
|---|---|---|---|---|---|
100 |
-4,359.763 (0.116) |
-4,360.227 (0.124) |
-4,359.096 (0.021) |
-4,362.971 (0.054) |
-4,370.171 (0.091) |
500 |
-4,360.183 (0.008) |
-4,360.183 (0.008) |
-4,360.183 (0.008) |
-4,360.846 (0.015) |
-4,362.880 (0.043) |
2,000 |
-4,359.894 (0.012) |
-4,359.894 (0.012) |
-4,359.894 (0.012) |
-4,360.265 (0.009) |
-4,360.824 (0.027) |
The differences from the exact estimates are simulation error, far below the standard errors (0.1 to 0.2). With 100 draws the simulated likelihood has several local maxima, and the libraries stop at different ones.
Two settings differ from the libraries’ defaults. xlogit runs with its L-BFGS-B optimizer: its default BFGS stops after two iterations on this model (“local search could not find a higher log likelihood value”), at a log-likelihood of −5,058. jaxlogit estimates a standard deviation through a softplus and reports the parameter before the transformation; the benchmark reports the standard deviation itself.
Scaling
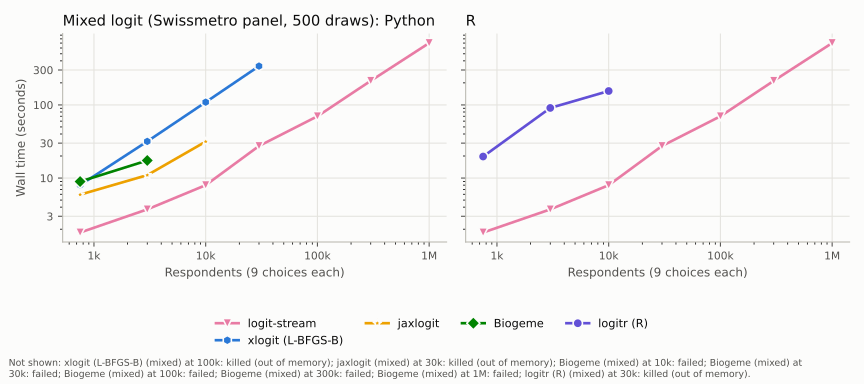
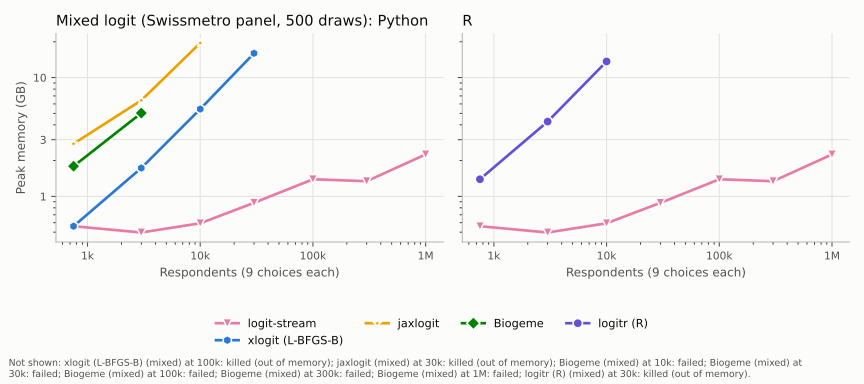
Larger samples are drawn from the 752 respondents with replacement, whole respondents at a time, up to a million respondents (27 million rows of alternatives), with 500 draws per respondent.
logit-stream was the fastest at every size, the survey itself included: 1.8 s at 752 respondents, against 5.9 s for jaxlogit, 8.0 s for xlogit, 9.0 s for Biogeme and 20 s for logitr; at 10,000 respondents, 8.0 s against 32 s (jaxlogit), 109 s (xlogit) and 155 s (logitr).
Its memory stayed between 0.5 and 2.3 GB up to a million respondents. jaxlogit’s grew by about 1.9 GB per thousand respondents (19.5 GB at 10,000) and ran out of memory at 30,000; logitr’s, 13.7 GB at 10,000, did the same; xlogit’s grew by about 0.55 GB per thousand, and it ran out at 100,000.
The time is linear in the data, about 0.7 ms per respondent at 500 draws: 12 minutes for a million respondents. Unlike the other models, the mixed logit is limited by arithmetic, not by reading the data, so the time also grows in proportion to the number of draws. (A GPU halves it: see GPU.)
Biogeme finished at 752 and 3,000 respondents. At 10,000 and above it refused to start: its default analytical Hessian (500 draws, 90,000 observations) is estimated to exceed its memory budget, a quarter of the memory available, and it suggests a chunked Hessian instead. It is counted as out of memory here, at the library’s defaults like the others. logitr returned its starting values at 10,000 respondents (all coefficients zero, not converged after 12 iterations), shown as “did not converge” in the tables.
xlogit and jaxlogit agree with logit-stream to within 2e-5 at every size where they finished; Biogeme’s coefficients differ by up to 0.009 and logitr’s, at the two sizes where it converged, by up to 0.05, the simulation error of their own draws.
logit-stream’s optimizer takes Newton steps with a finite-difference Hessian, then quasi-Newton (BFGS) steps, confirming convergence with the Hessian itself: 15 to 18 steps here.
Tables
The numbers behind the figures. A dash means the library was not run at that size, because it failed or timed out at a smaller one.
Wall time (seconds)
respondents |
logit-stream |
xlogit (L-BFGS-B) |
jaxlogit |
Biogeme |
logitr (R) |
|---|---|---|---|---|---|
752 |
1.8 |
8.0 |
5.9 |
9.0 |
19.7 |
3,000 |
3.7 |
31.7 |
11.0 |
17.4 |
90.9 |
10,000 |
8.0 |
109 |
31.5 |
out of memory |
did not converge |
30,000 |
27.5 |
339 |
out of memory |
out of memory |
out of memory |
100,000 |
70.0 |
out of memory |
– |
out of memory |
– |
300,000 |
214 |
– |
– |
out of memory |
– |
1,000,000 |
702 |
– |
– |
out of memory |
– |
Peak memory (GB)
respondents |
logit-stream |
xlogit (L-BFGS-B) |
jaxlogit |
Biogeme |
logitr (R) |
|---|---|---|---|---|---|
752 |
0.56 |
0.56 |
2.77 |
1.79 |
1.39 |
3,000 |
0.50 |
1.73 |
6.43 |
5.02 |
4.26 |
10,000 |
0.59 |
5.43 |
19.53 |
out of memory |
did not converge |
30,000 |
0.88 |
16.00 |
out of memory |
out of memory |
out of memory |
100,000 |
1.39 |
out of memory |
– |
out of memory |
– |
300,000 |
1.34 |
– |
– |
out of memory |
– |
1,000,000 |
2.26 |
– |
– |
out of memory |
– |